Creating a Map
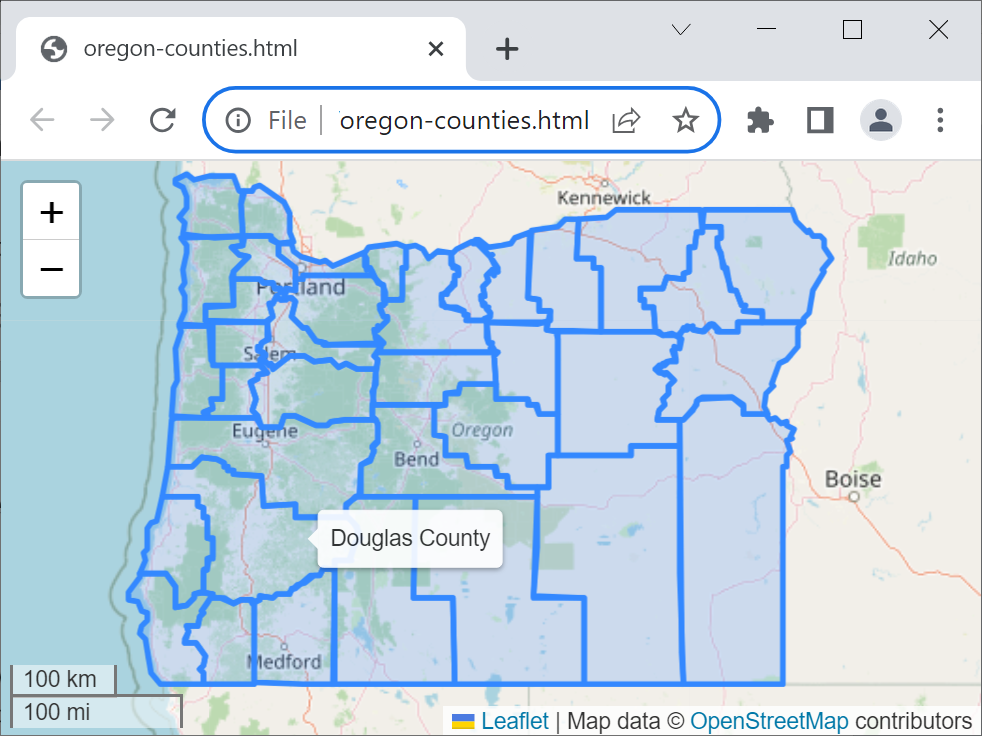
The easiest way to visualize features and other geometric objects is to place them on a Map (a Leaflet-based web map). Create one via the map property of a feature or feature set, or directly:
geodesk.Map(attributes)
The optional attributes customize the look and behavior of the map and its elements (described below).
Using a Map is easy: add() elements, then save() it as an HTML file and/or show() it in a browser window:
features("na[tourism=hotel]").map.save("hotels")
# (.html file extension by default)

my_map = Map()
my_map.add(features("na[amenity=fire_station]"), color="red")
my_map.add(features("n[emergency=fire_hydrant]"), color="orange")
my_map.show()
Map Attributes
These attributes apply to the map itself. They can be passed as keyword arguments or accessed as properties of the Map object.
basemap | Tile server URL for the base map (Default: OpenStreetMap Carto) |
attribution | Attribution text to display at the bottom of the map (This is required if you publicly display your map, and defaults to “© OpenStreetMap”) |
leaflet_version | Version of the Leaflet to use |
leaflet_url | URL from which Leaflet is loaded (By default, Leaflet is loaded from UNPKG) |
leaflet_stylesheet_url | URL for a custom CSS file (to customize the appearance of the Leaflet map controls) |
min_zoom | Minimum zoom level. Default: 0 |
max_zoom | Maximum zoom level: Default: 19 |
Element Attributes
These attributes apply to individual map elements. They can be passed as keyword arguments or accessed as properties of the Map object (in which case they act as default attributes).
tooltip | Text (HTML) to display when the user places the mouse cursor over an element. Default: None |
link | URL to navigate when the user clicks on an element (see details below). Default: None |
stroke | Whether to draw the element’s stoke. Default: True. Use False if you don’t want borders around polygons or circles. |
color | The stroke color. Default: "blue" |
weight | Stroke width in pixels. Default: 3 |
opacity | Stroke opacity. Default: 1.0 |
lineCap | A string that defines shape to be used at the end of the stroke. Default: "round" |
lineJoin | A string that defines shape to be used at the corners of the stroke. Default: "round" |
dashArray | A string that defines the stroke dash pattern. Default: None (solid line) |
dashOffset | A string that defines the distance into the dash pattern to start the dash. Default: None |
fill | Whether to fill the element with color. Default: True. Use False to disable filling polygons or circles |
fillColor | Fill color. Defaults to the value of color |
fillOpacity | Fill opacity. Default: 0.2 |
(Adapted from Leaflet API Documentation — © 2010 – 2013 Volodymyr Agafonkin. Licensed under BSD-2-Clause)
Map.link
You can use template arguments in the link property to customize the link for each individual Feature. Any attribute of Feature is accepted (including tags).
To open the feature’s website (if it has one):
link="{website}"
To display the feature on the official OpenStreetMap website (where you can see more information, such as its revision history):
link="https://www.openstreetmap.org/{osm_type}/{id}"
To edit the feature in iD (the default OpenStreetMap editor):
link="https://www.openstreetmap.org/edit?{osm_type}={id}"
Methods
Map.add(item, attributes=None)
Creates a map marker for the given item:
- a geometric object (
Coordinate,Box,FeatureorGeometry) - any object that has an
add_to_map(Map)method - an iterable that contains any of the above (e.g. a feature set)
Map.save(filename)
Saves the map as an HTML file (If the file name has no extension, .html is used).
Map.show()
Opens a browser window to display the map. If the map hasn’t been explicitly saved to an HTML file, this method creates a temporary file.